INSAR PROCESSING AND GEOKINESIA PROCESSING CHAIN
INSAR PROCESSING METHOD
There are different approaches to InSAR data processing. GeoKinesia exploits a proprietary Persistent Scatterer Interferometry (PSI) InSAR processing technique.
PSI is a group of techniques for deformation measurement and monitoring using InSAR imagery. PSI represents an advanced type of Differential InSAR (DInSAR) and is based on large stacks of SAR images and suitable data modelling procedures that enables the estimation of different parameters, including the deformation time series, the average displacement rates and the so-called residual topographic error (RTE).
InSAR technology plays a crucial role in PSI, providing the necessary data for deformation analysis and measurement. The RTE, which is the difference between the heights of the scattering phase of a center of a given point with respect to the digital elevation model (DEM) used in the PSI processing, is an important parameter in both PSI modeling and geocoding.
GEOKINESIA TECHNOLOGY
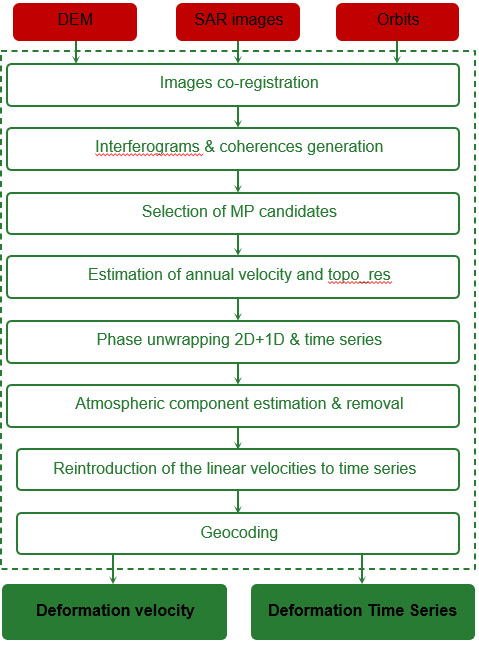
The main processing steps of GeoKinesia’s proprietary technology are explained with specific reference to the software chain of GeoKinesia. The software is composed of several modules that can be used in different workflows, adopting the one that is more appropriate for each application. network).
1.Input data. The procedure requires three types of input data: (i) a stack of complex SAR images covering the same area; (ii) the precise orbits corresponding to each SAR image; and (iii) a DEM of the covered area.
2.Image co-registration. All the SAR images needs to be co-registered, i.e. a pixel with image coordinates (i,j) of any image must correspond to the same footprint on the ground. Co-registration requires the resampling of all images onto the grid of the reference one, to ensure pixel-to-pixel alignment along the entire image stack.
3.Interferograms and coherences generation. The interferogram network is generated using several image-pairs combinations, in a way that each image is used to generate more than one interferogram (redundant network).
4.Selection of Measurement Points (MPs) candidates. In this step so-called MP candidates are selected. It is a first selection of the pixels that are potentially good (of low noise), however their actual quality is then evaluated during the processing. Properly identifying good MPs candidates is important for the following steps, especially the phase unwrapping and the estimation of the atmospheric component. A pixel is considered a MP candidate if its DA is low, meaning that the backscattered energy is strong and stable in time. GeoKinesia has developed and successfully exploits new and innovative tools to select MP candidates.
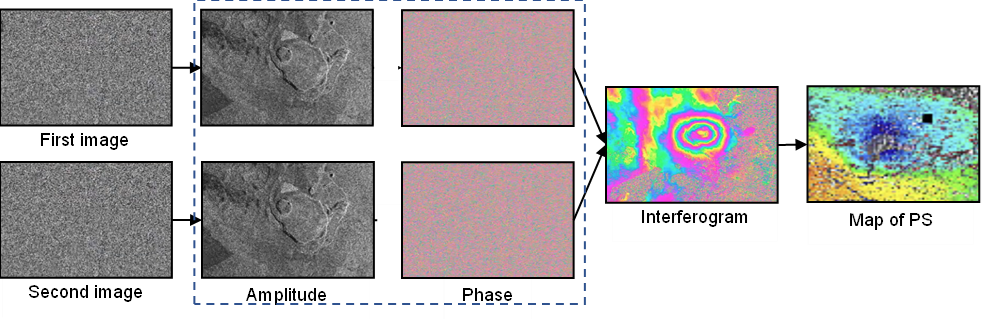
The illustrations below provide some visualisation of the steps 2,3.
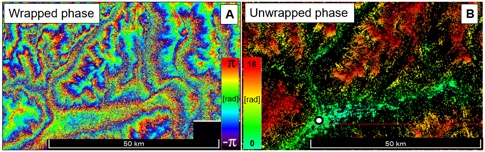
This is an illustration of the step 5 for phase unwrapping. On the left the wrapped and on the right the unwrapped interferogram. The circle shows the position of the reference-stable point set to zero. This is a key step in the InSAR processing.
5. Estimation of annual velocity and residual topographic error. The displacement velocity and the residual topographic error (topo_res) are estimated for each MP candidate, using the wrapped interferograms. The topo_res is estimated and then removed from the wrapped interferograms. The topo_res is then used for a precise 3D location (geocoding), representing the elevation of the MP footprint with respect to the DEM information.
6. Phase unwrapping. This operation involves the estimation of the phase ambiguity in both space and time. This is the most critical step of the entire procedure. Several approached have been proposed to perform it. Firstly, a spatial 2D phase unwrapping is performed for each interferogram. Secondly, for each MP the 1D temporal phase unwrapping is performed using all the unwrapped interferograms to generate the displacement time series.
7. Atmospheric component estimation. In this module, the atmospheric phase component is estimated and subsequently removed from the phases. The atmospheric component is estimated on the output of the 1D+2D phase unwrapping. Then it can be removed from the interferograms, to perform again the steps 3, 4 and 5, or directly from the Time Series.
8. Reintroduction of the linear velocity to the time series. In this step the linear velocity, previously excluded, is taken back into account.
9. Geocoding. The MPs coming from the previous module are in the radar geometry of the reference image by two coordinates: azimuth and range. The geocoding or geolocation procedure allows us to estimate the geographical or cartographic coordinates of the MPs.
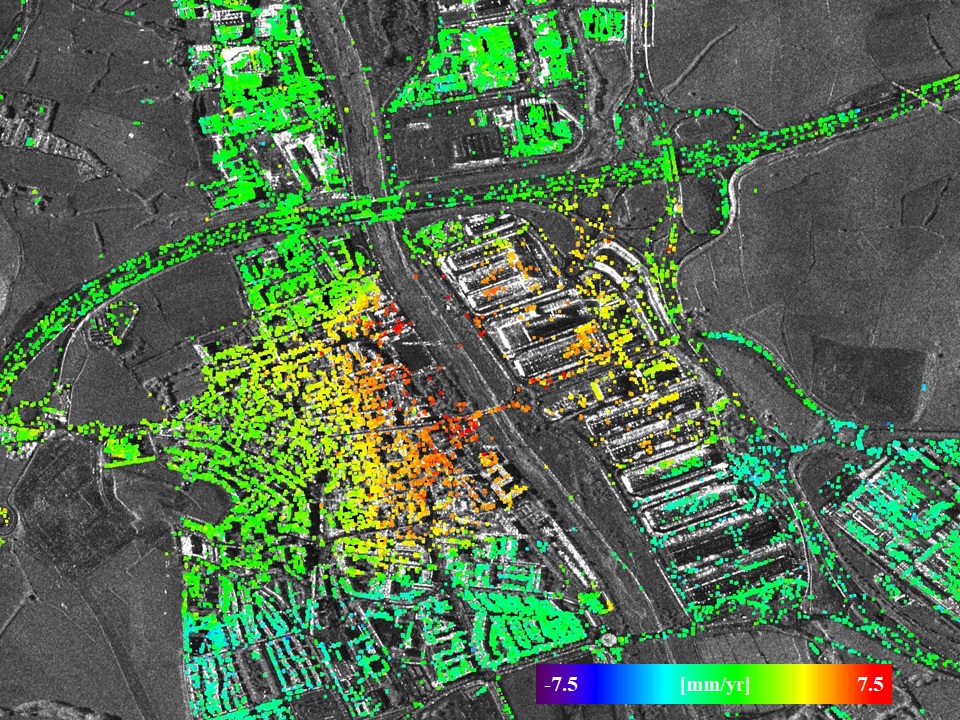
FINAL RESULTS
- Deformation velocities maps
- Cumulative deformations maps
- Time series
- Horizontal and vertical movement analysis
Georeferenced points are overlaid on an optical satellite image or a topographic map.
Some results of GeoKinesia InSAR analysis are shown below.
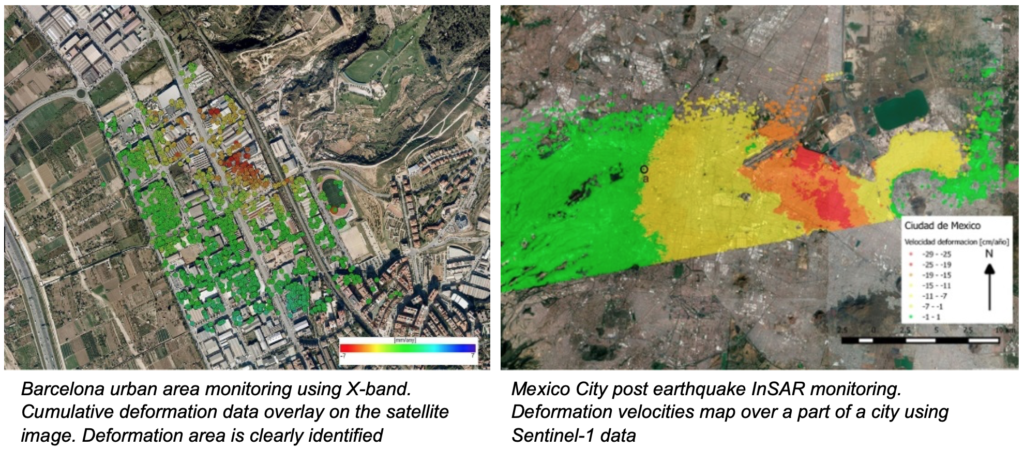
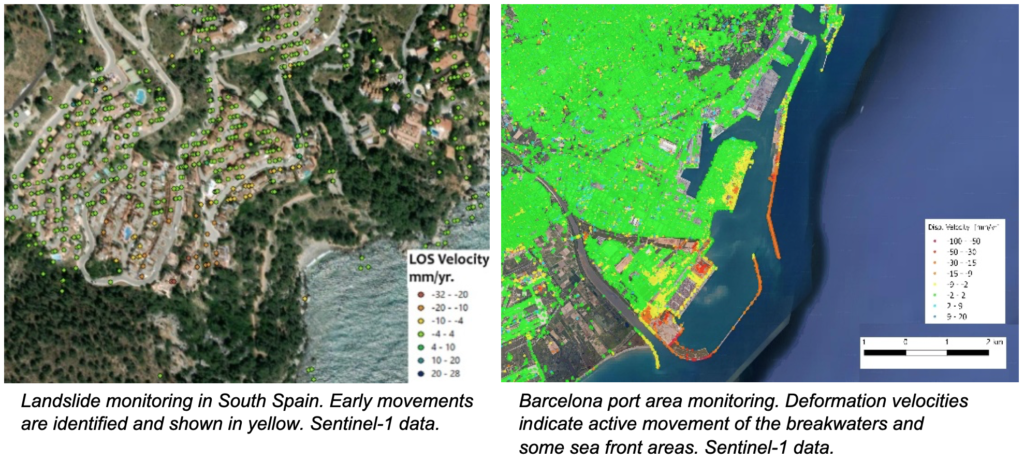
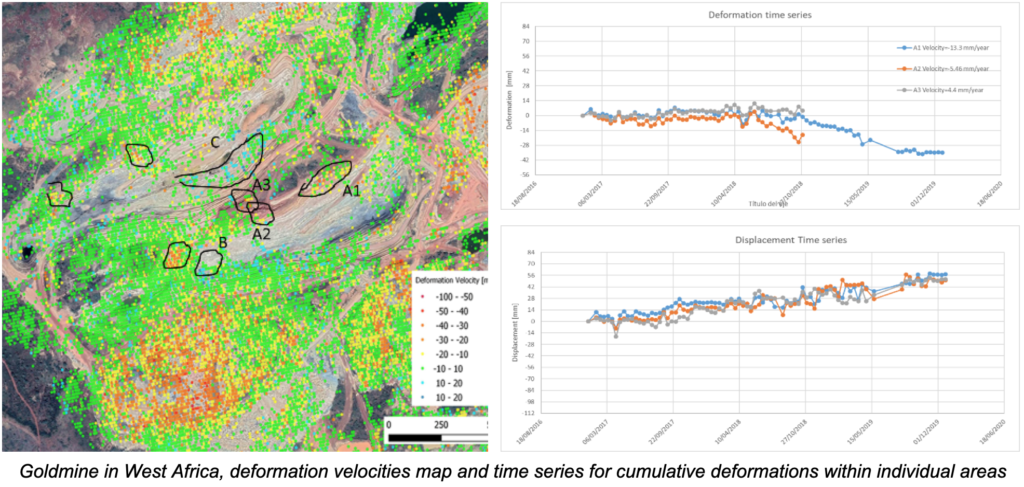
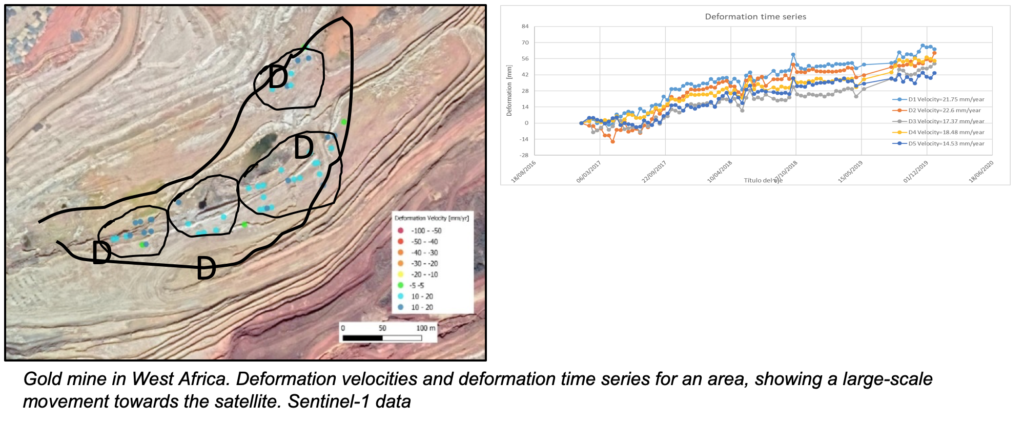
The final results of the InSAR analysis are usually presented in the form of a report or on a visualisation platform.
Most of the platforms allow analysis of the times series for individual points or group of points, for different time periods, statistical analysis of the values — average, standard deviation etc. Integration with other sensors – remote or in situ is also a standard feature of most of the platforms.